Introducing True Wave Scanner: Your Automated Elliott Wave Analyst
For traders who rely on the Elliott Wave principle, the process is powerful but often…

If you’re like me, you’re always on the lookout for the next trading book to pick to improve your trading skills. I bought a Kindle with unlimited subscription only because I found that there were dozens of trading books available in the subscription. If I bought all those books, it would have cost me a…

For traders who rely on the Elliott Wave principle, the process is powerful but often painful 😫 Manually cycling through hundreds of charts, validating wave counts, and tracking setups is a significant time investment. It’s far too easy to miss a perfect pattern on a stock you weren’t watching. Today, I’m excited to launch the…

I have been sharing daily Elliott Wave analysis of NIFTY50 index on YouTube since last 1 month or so,. It doesn’t make sense for me to share the same as a post on the blog daily hence I have created a YouTube playlist of the daily analysis that you can see on the right section…

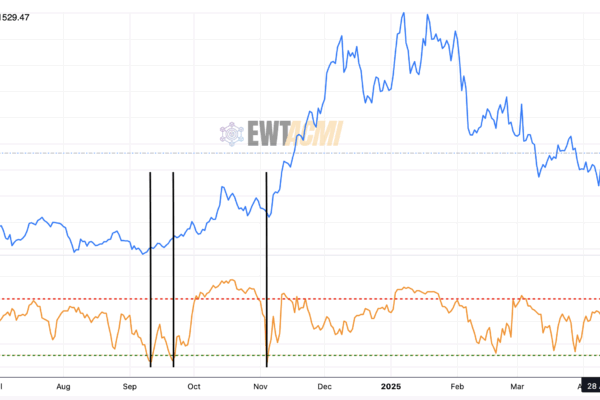
ACMI Crypto Market Breadth Oscillator chart combines the ACMI Index with a custom-built Breadth Oscillator based on Relative Strength (RS). It gives an instant read on market participation — telling you whether a majority of top cryptos are rising together, or if leadership is narrowing.

Cardano (ADA) has given a bullish crossover in ACMI RS after a fake crossover couple of days back. Last time ADA crossed over RS > 1, it moved from 0.77 to 1.14 within a single day right next day after crossover. Could something similar happen this time?

The crypto space is noisy. With thousands of coins, stablecoins, wrapped assets, and bots pumping fake volume, it’s hard to get a clean read on where the market truly stands. Introducing EWT ACMI – A Smarter Way to Track Crypto Market Health.

NIFTY is making a bounce after a clean 5 waves down in daily chart which indicates there is likely going to be another set of 5 waves down in 3 or C, depending on how we treat the first 5 waves down (1 or A). Watch the videos for important levels to watch out for.

#nifty50 has formed a 5 wave decline in daily chart which is an indication of the trend of changing from up to downside. Depending on how this move unfolds, check out the potential targets for this move in the video.

S&P 500 fell nearly 2.5% on Friday last week (28th March) and on Monday, we saw a bullish piercing candlestick. However, it doesn’t look like that this bullish move would sustain and its likely S&P 500 would resume its downside soon. Watch the video to understand the reasons for the same.
![[Announcement] Elliott Waves Trading YouTube Channel EWT Announcements](https://elliottwavestrading.com/wp-content/uploads/2025/01/Modern-Gradient-Beauty-and-Fashion-Blog-Facebook-Cover-600x400.png)
I have started YouTube channel where I share updates based on Elliott Waves and price action. Due to that, I am not able to post as much as I used to on this blog but I plan to update both this blog and the YouTube channel as and when I can. You can check out…

It’s a double whammy: U.S. credit card defaults jump to the highest level since 2010 as personal savings dry up. Expectations for the months ahead are even more glum. Elliott Wave International lay it out in their November Financial Forecast: The latest New York Fed Consumer Loan Survey reveals that consumers’ expectations for delinquencies rose to…