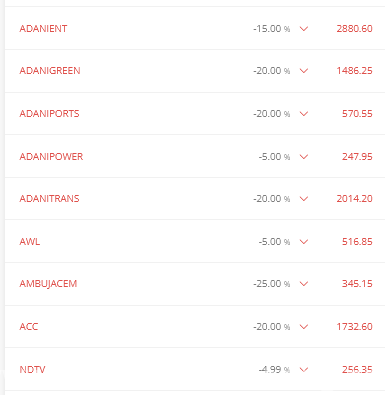
Friday’s fall of Adani group stocks post Hindenburg report was extraordinary. Adani group stocks have been the favorites of Indian stock traders as they rose in multiple of 100s and even 1000x in just a span of few years.
Here is how Adani group stocks looked yesterday (nearly all of them in lower circuit).

Twitter was full of discussions yesterday on how this was completely unexpected and nobody could have predicted such a solid downside in Adani stocks. This made me curious because in my experience price always shows what’s coming. Hence I opened Adani group’s primary stock Adani Enterprises (ADANIENT).
It took just a minute to realise that as per TA, this was kind of expected. Stock had been forming a bearish rising wedge since September last year. The lower line of wedge decisively broke down on 10th January this month with good volumes and a close below it. Breakdown was followed with a retest and then it fell in clean 5 waves down. As per classic TA, the minimum target was just below 3000 based on height of wedge formation but the price went much below further.
Point I am trying to make here is that price reflects everything much before something is public knowledge so if you practise TA, chances are you won’t be caught unaware like this. Hindenburg report came this week but bearish pattern breakdown was confirmed well in advance on 10th January.


